Climate Action Plan: Progress
Since signing Second Nature’s Climate Commitment in 2007, Carolina has completed an exhaustive annual GHG inventory. These analyses show Carolina has reduced its GHG emissions by 32%, despite significant campus growth. This decrease was achieved with emission reductions in every category except for refrigerants and commuting. The graph below illustrates Carolina’s emissions since 2007. For a detailed trend report, please visit our SIMAP Emissions Reporting page.
Since 2007, Carolina’s largest GHG emission reductions have come from:
- Energy Efficiency – Despite a 27% increase in square footage and a 9% increase in population since 2007:
- Campus steam use per square foot has fallen by 32%.
- Campus electricity consumption per square foot has fallen by 34%.
- Stationary Combustion – Carolina reduced its coal use at the cogeneration plant by 64% since 2007.
- Purchased Electricity – Due to efficiency projects and a cleaner grid, emissions have fallen 44% since 2007.
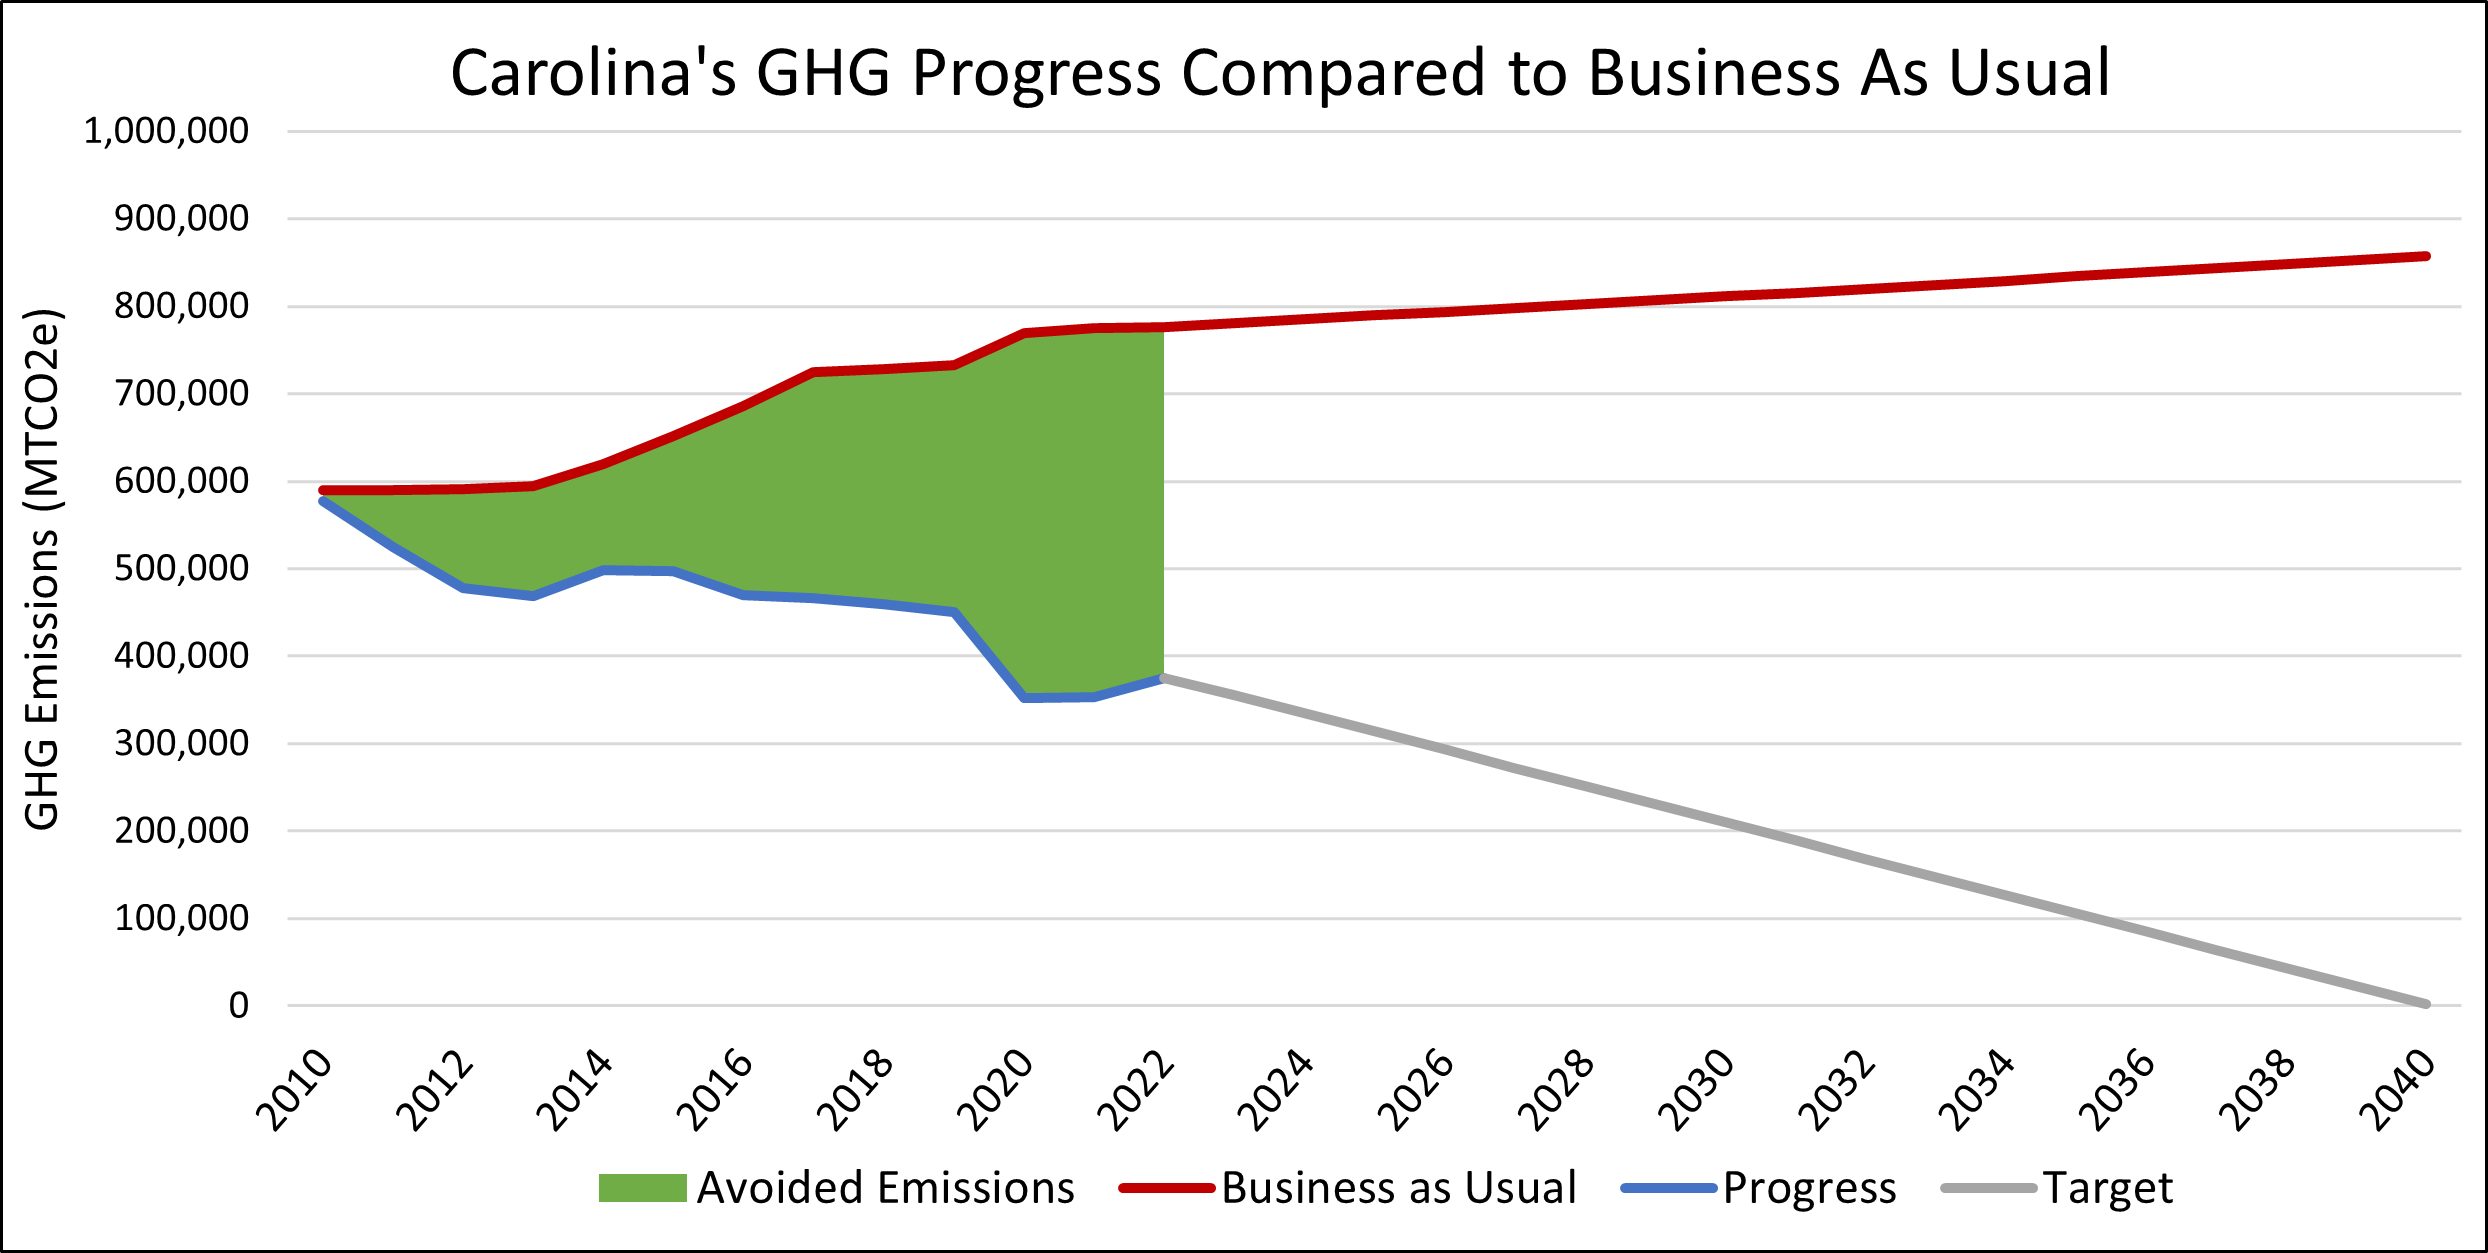
In the 2009 Climate Action Plan, a business-as-usual scenario (see graph above) was modeled to predict future emissions with no action. With predicted increases in campus and population sizes, this scenario forecasted emissions rising to almost 800,000 MTCO2e by 2020 and over 900,000 MTCO2e by 2050. However, due to the actions described above and COVID-19 pandemic-related disruptions to campus use, Carolina’s actual 2021 emissions were 54% lower than predicted, and nearly 2.5 million metric tons of CO2e emissions have been avoided since 2010.