Reactive nitrogen in the environment causes impacts to environmental and human health. Examples of reactive nitrogen include nitrogen oxides, ammonia, nitrate, and nitrite. Reactive nitrogen is created through natural processes and human activities, but inputs of reactive nitrogen are 7x greater than inputs from natural sources. A nitrogen footprint is the amount of reactive nitrogen that enters the environment through human activities minus the nitrogen that is prevented from entering the environment.
One way that humans create a nitrogen footprint is by combusting fossil fuels. Fossil fuel combustion is currently the primary source of heat that humans use to power engines and to generate electricity and steam. Since the nitrogen footprint of fossil fuel combustion is predominantly NOx, NOx emissions will fall as energy production transitions to renewable sources.
“A nitrogen footprint is the amount of reactive nitrogen that enters the environment through human activities minus the nitrogen that is prevented from entering the environment.”
Other human activities that contribute to a nitrogen footprint include food and waste production. The nitrogen in fertilizer comes in many reactive forms including nitrates and ammonia. Nitrogen fertilizer and human-enhanced biological nitrogen fixation have improved crop yield to levels that sustain about half of the world’s population. However, about 80% of the nitrogen used to produce food is lost to the environment before consumption, and the remainder is lost after consumption as human waste. However, nitrogen is prevented from entering the environment when food waste is composted, therefore composting is considered a nitrogen sink.
Nitrogen moves through the Earth’s atmosphere, forests, grasslands, and waters, causing environmental changes that negatively impact both people and ecosystems. These changes include smog, acid rain, biodiversity loss, stratospheric ozone depletion, and an enhanced greenhouse effect.
UNC’s Nitrogen Footprint
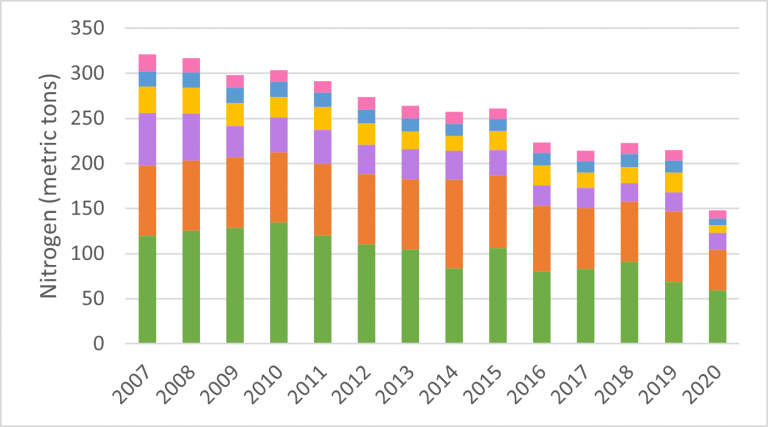
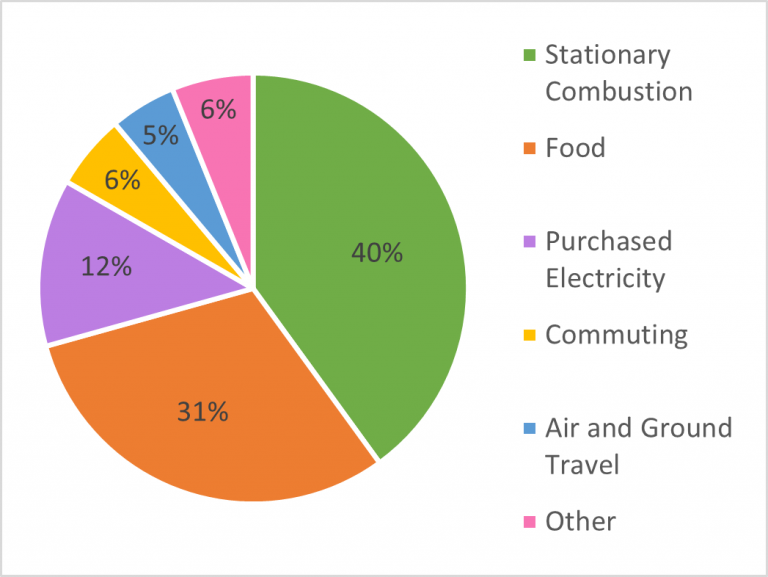
Stationary Combustion historically contributes 30-45% to UNC’s nitrogen footprint, food contributes 25-40%, purchased electricity contributes 10-20%, commuting contributes 5-10%, and air travel contributes 5-7%. Other sources of nitrogen include wastewater, fertilizer, and transmission and distribution losses associated with electricity.
In 2020, UNC’s nitrogen footprint had fallen 56% from the 2007 baseline. However, it is important to consider the impact of the COVID-19 pandemic on campus use in 2020. A more accurate picture of nitrogen footprint shrinkage is the 2019 reduction compared to baseline which is 27%.
UNC’s nitrogen footprint tends to shrink as the carbon footprint shrinks although the reduction occurs at different rates. This difference occurs because the nitrogen intensity of one source is not necessarily comparable to its carbon intensity. For example, food purchases make up ~30% of the nitrogen footprint and ~1% of the carbon footprint. Compost offsets 3-8% of the nitrogen footprint yet offsets none of the carbon footprint.